Weighted comparison
Set your own criteria and weights, score each option, and see exactly how every total is calculated.
Decision intelligence · Project risk
Structure a project decision from question to recommendation. Compare options with a weighted matrix, keep a living risk register, challenge assumptions, and see what happens when costs rise or timelines slip.
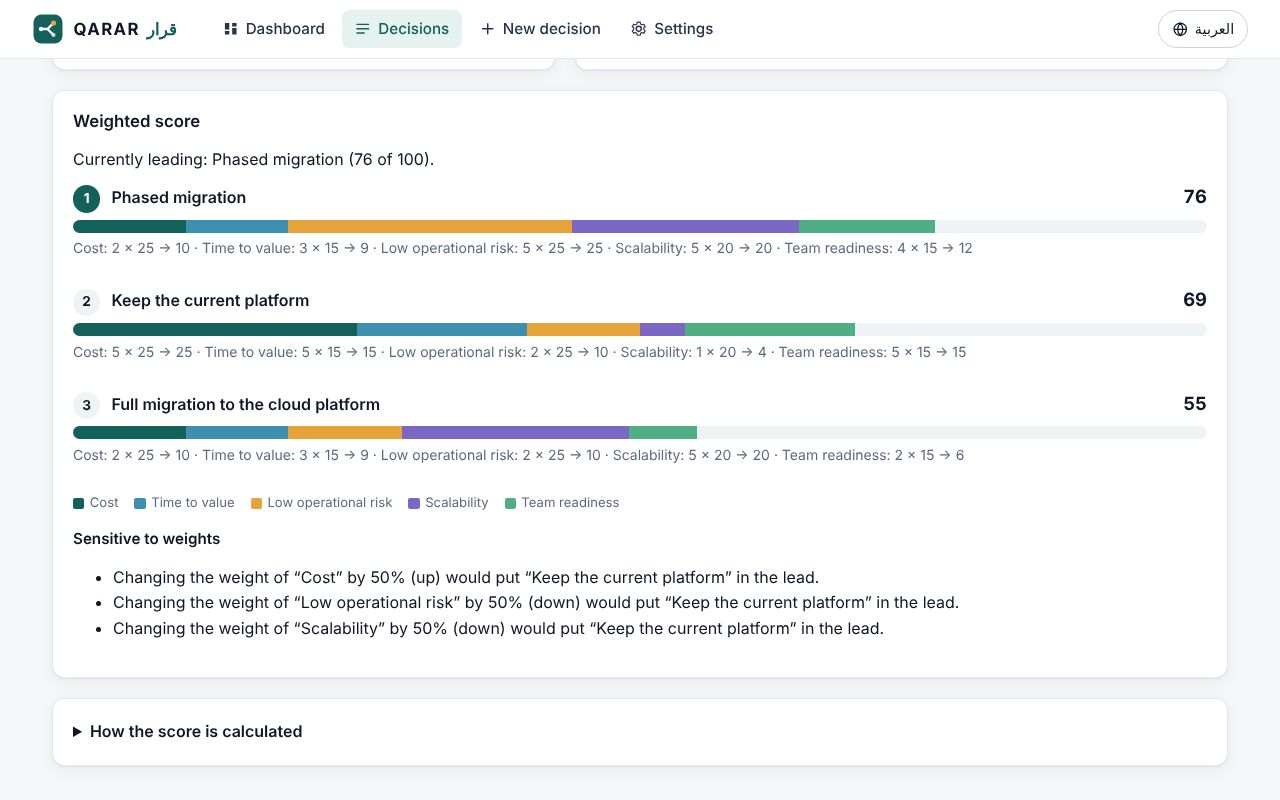
Set your own criteria and weights, score each option, and see exactly how every total is calculated.
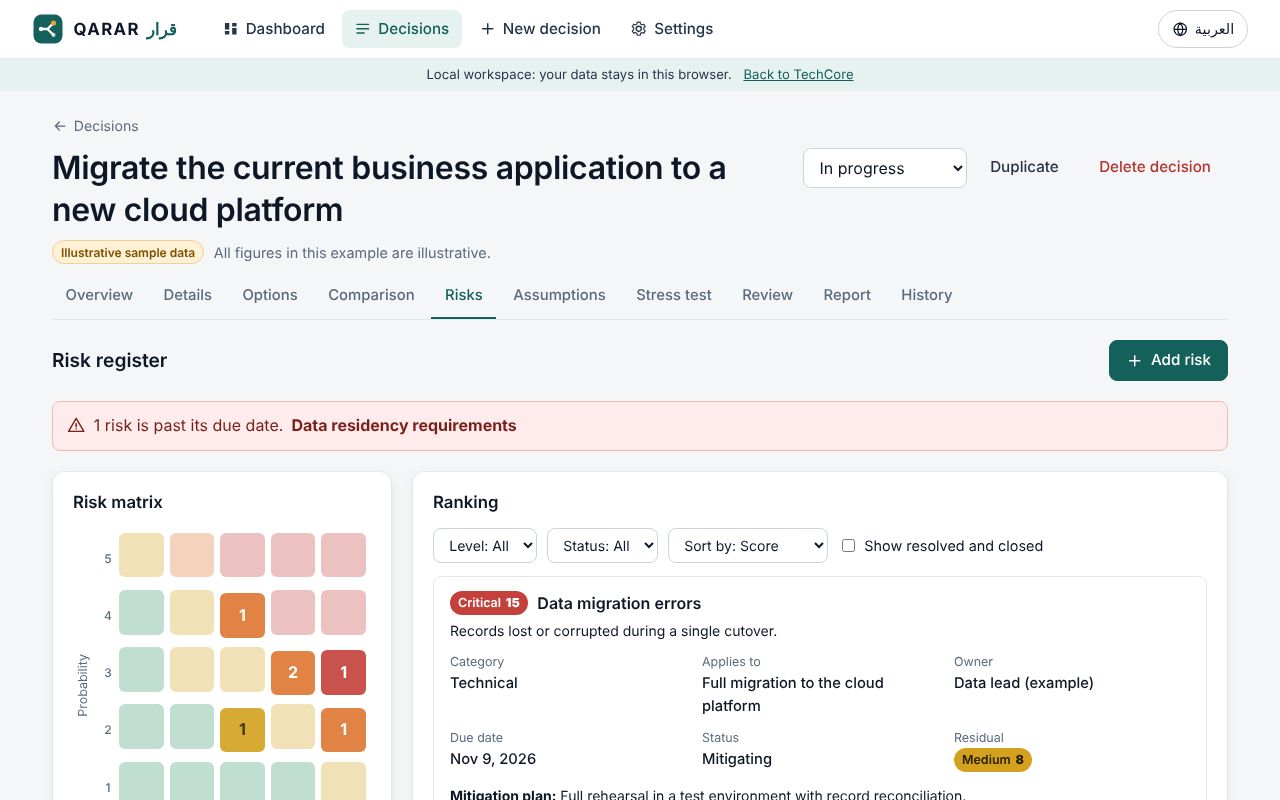
Probability × impact scoring, a 5×5 matrix, owners, mitigation, due dates, and overdue alerts.
Track what is unverified, missing, or waiting on someone, and mark each item as it is confirmed or rejected.
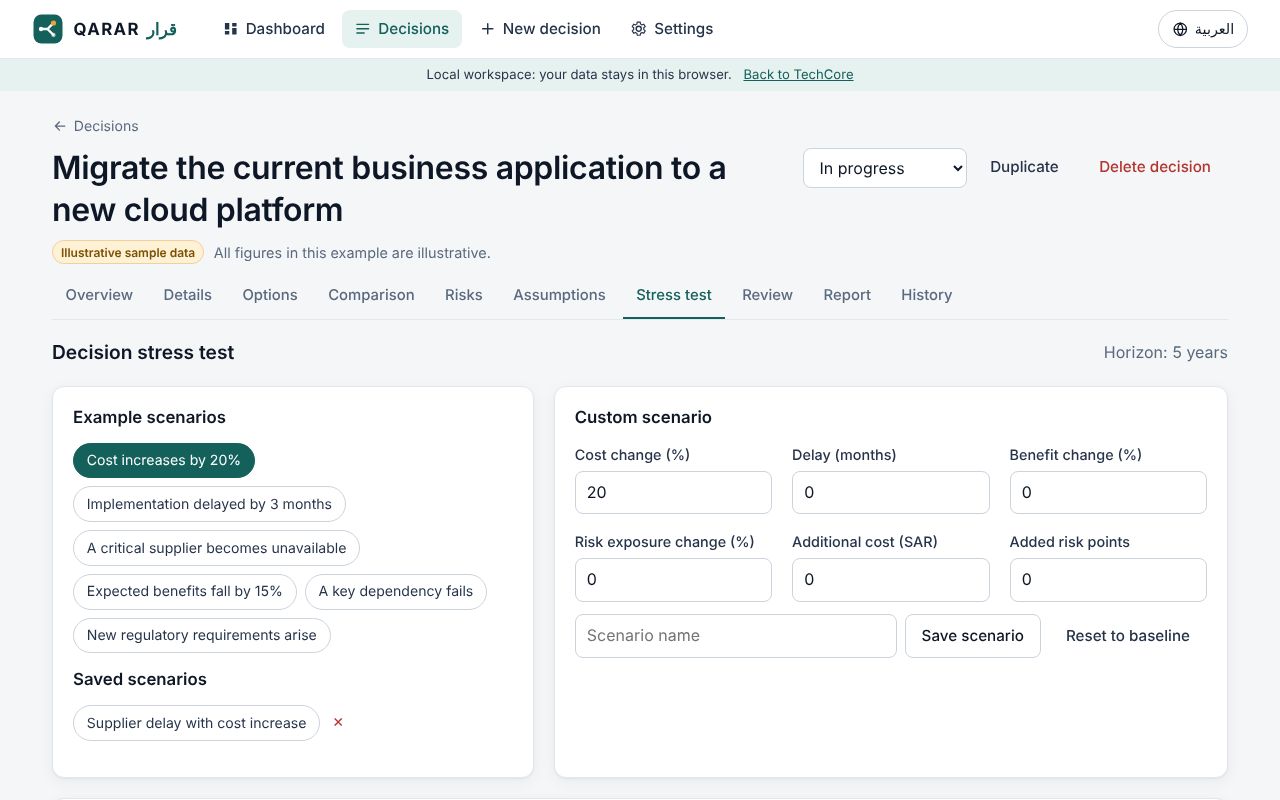
Apply cost, delay, benefit, and risk changes to each option and compare the result with the baseline.
Transparent rule-based checks, plus an optional independent review by Claude for signed-in users.
Save decisions to your account, open them on any device, and share them with view or edit access.
A management-ready report in Arabic or English that you can print or save as PDF.
Context, problem, desired outcome, owner, deadline, budget, and success criteria.
Cost, time, benefit, evidence, and a weighted score for each option.
Risks, assumptions, and scenarios show how fragile the leading option is.
Generate the report, set the final status, and keep the history.
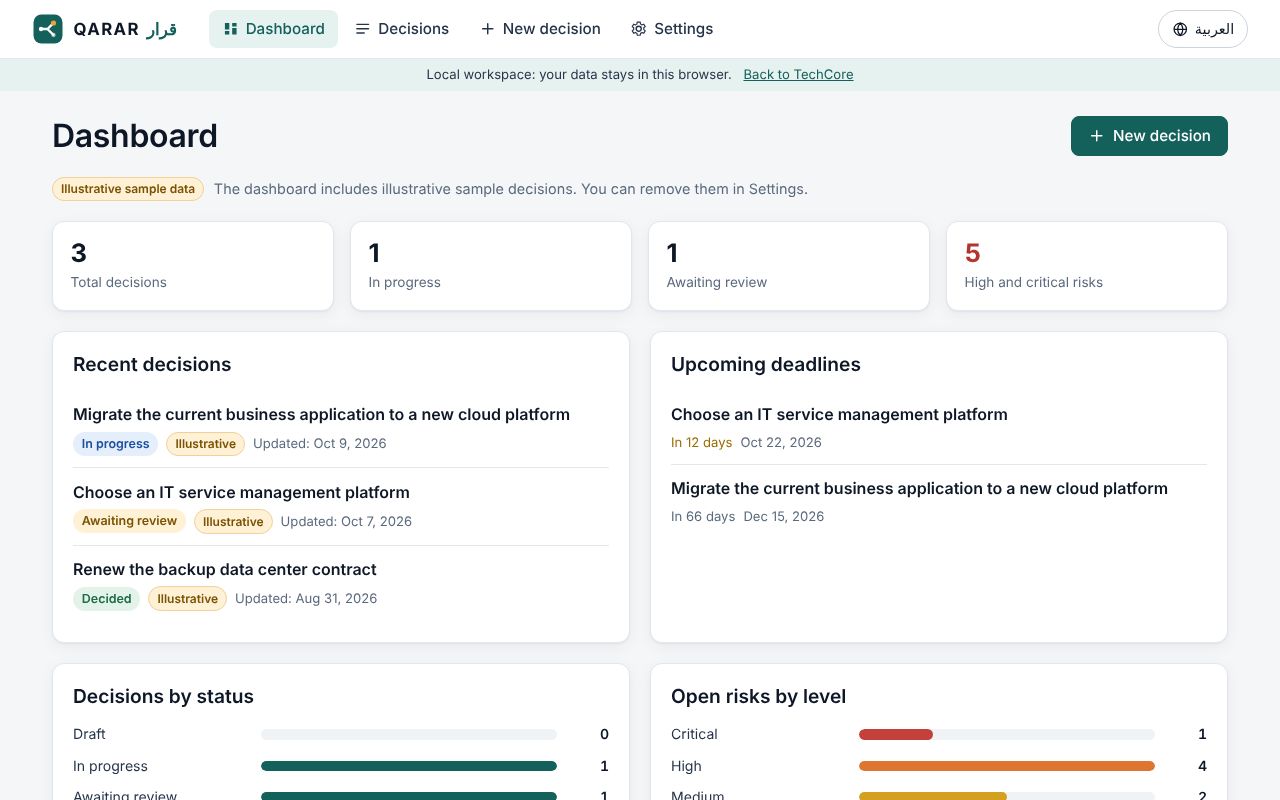
Live previews calculated from the illustrative cloud-migration example in the demo. Illustrative sample data
Currently leading: Phased migration (76 of 100).
Score = probability × impact (1–25). Low 1–4 · Medium 5–9 · High 10–14 · Critical 15–25. Exposure is the sum of scores of open risks.
Net value over horizon · Horizon: 5 years
QARAR is live. You can use it without an account (decisions stay in your browser), or sign in to save decisions to your account, share them with view or edit access, and request a review from Claude. The comparison, risk, and scenario numbers are always calculated by QARAR’s own documented formulas.